

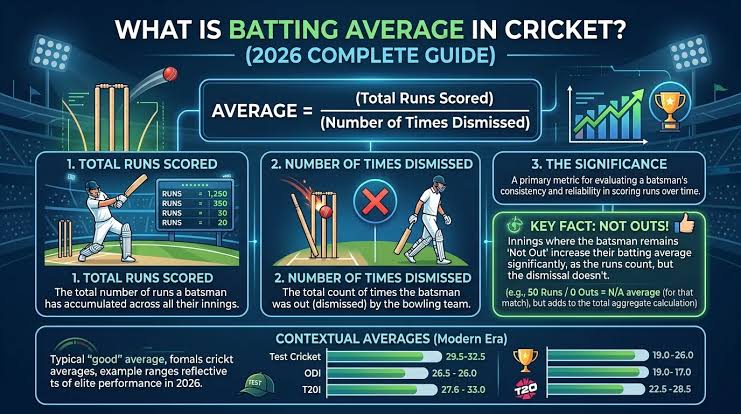
A player’s statistics can include a .500 batting average and a low strike rate or a low batting average with a high strike rate. Those numbers represent various aspects of batting. Average is a relationship between runs and dismissals. Strike rate is a percentage of runs per ball faced. Both can be used to explain figures on live scorecards and tournament summaries. The most helpful comparison begins with the objects each figure represents and the objects it matches.
What average and strike rate measure
Batting average measures runs per dismissal. Batting strike rate measures runs per 100 balls faced. Average describes run output relative to how often a batter gets out. Strike rate describes scoring pace. Readers following desi online live cricket betting can apply this distinction when examining player figures. Both need context about the innings and the player’s task.
Check whether the figures belong to the current innings, a tournament, or a career. An innings strike rate updates as the batter scores and faces deliveries. A career average combines results across many innings. Also confirm that the column concerns batting. Bowling strike rate measures balls per wicket, so its meaning and the direction of comparison differ from the batting statistic discussed here.
How batting average is calculated
Batting average equals total runs divided by times the player was bowled out. Runs from innings where a player remains undefeated count toward the total, but those innings do not add to the total dismissed count. That difference of an extra dismissal is what turns it into a batting average as against an average per game in general.
A batting average can be estimated by using the number of dismissals recorded through a series of innings. If dismissals are only bowled out or not-out type of innings then the number of dismissals equals the number of innings played minus the number of times the batter remained undefeated.
Assume a player has scored 240 runs in 8 innings out of which only two are “not-outs”. The total number of 6 times that the player was out would lead to Batting average of 40.00. However, if one were to divide the total number of runs by all the 8 innings, the answer would be 30.00 and that would be a different question altogether.
We cannot calculate the denominator in the case that a batter has not been dismissed in his/her chosen period and therefore the conventional batting average has not been defined whereas the batting profile still shows the runs scored and the unbeaten sessions.
How batting strike rate is calculated
The formula used is Batting strike rate = runs scored / balls faced x 100. A batsman takes 30 balls to score 45 runs which translates to a 150.00 strike rate. This is a rate of 150 runs per every 100 balls. Not to imply that the batter really scored 150 runs. The balls-faced scorecard number will be used to verify the calculation.
When finding a combined strike rate, add up all runs and all balls faced in the selected timeframe and then divide the total to give the combined strike rate. Strike rates are calculated separately for each of the innings and then the ordinary average is taken. Then the appearance of a 5-ball would have the value of a fifty-ball innings. The actual number of deliveries faced is used as the formula weight for the aggregate.
Why format and batting position affect comparisons
Batters work within different time limits and match situations. An opener starts against the new ball, while a finisher may arrive with only a few overs remaining. A comparison becomes more informative when its scope matches. Check:
- Match format, such as T20 or ODI.
- Batting position and typical entry point.
- Competition and standard of opposition.
- Dates covered by the statistics.
- Innings played and balls faced.
There is no single average and strike rate combination suitable for every role. A batter asked to extend an innings may face more deliveries than someone sent in for a brief burst. Even within T20, similar headline figures can come from different responsibilities. Start with comparable roles, then use the numbers to examine output and pace rather than declaring a universal ranking.
Read not outs and sample size alongside the numbers
A quick showing can lead to a memorable strike rate. In another example of teaching, 12 runs were scored on six balls and the total score is 200.00. This is for 6 deliveries. The longer the record is the more opportunities to face a variety of bowlers and conditions. The evidence behind the rate can be created by looking at the number of balls faced, particularly when comparing with a career.
Not outs are worth noting, too. If the innings ends shortly after a player has entered the game, then that player can leave unbeaten if he bats late on a regular basis. Those runs count all the same and the result is still counted. Review innings, dismissals and bat opportunities. The average is not an indicator of the distribution of the scores. Individual innings results can help to indicate whether it was a trickle of runs or a few big runs.
A better order for comparing batters
First decide on your question, then pick your statistic. If you are comparing the speed of scoring, you will need to use strike rate. If you’re looking at runs per dismissal, you need to look at average To compare with maximum:
- Match the sign of Format and Statistical period.
- Read innings not outs and balls faced.
- Review average and strike rate as a pair.
- Discuss batting positions and players’ statistics.
Do not record the live innings in the longer record. The current strike rate is the rate of the contribution today, and the aggregates provide a summary of the contribution selected from the history. As a combined reading of those views, the player profile is more informative, but it’s not an invitation to the current player to believe that the past guarantees the future.